


by Tim Klatt, Director of Retail Strategies & Head of Vivalociti
Everyone working within a financial institution has questions that keep them up at night. Who are our consumers? What products and services should we be providing? What should our marketing material say? Where should we be marketing? Where should we be looking to go next? In most cases, the answers to these questions can be answered through map analysis!
I know what you’re probably thinking right now. You’re remembering back in middle school when you had to sit through Geography class and learn all the states and the capitals and thinking how could that possibly help me grow my business? Well, that map can't help you, but there are maps that can.
Geographers and Financial Industry Experts - like La Macchia Group - can use maps to provide you with a tremendous amount of insight when used properly.
In fact, over the last 15 years I have seen maps and G.I.S. (geographic information systems) evolve into essential tools for savvy organizations to make sound strategic decisions. The reason for this is simple; humans, by our very nature, are spatially oriented. We can’t help but group together with other like-minded humans creating communities with distinct demographic and socio-economic characteristics. Maps help spot trends and draw conclusions from these patterns; creating clarity out of seemingly random data.
Let's take a look at a large scale map created by Business Insider.
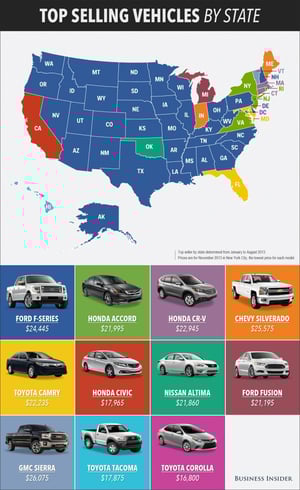
The first thing you might notice is, “wow, the Ford F-Series is doing great!” Well, you’d be right, but aside from that, what can we derive from this? What about the areas the Ford F-Series isn't a top seller?
The Ford F-series, and the success of trucks in general, showcases the fact that much of America, particularly the more rural parts, value utility in their vehicles. Conversely, states with greater urban populations overwhelmingly prefer sedans with much better gas mileage for their daily commutes. Then there is the pattern of the Northeast (and California) tending to prefer Honda & Toyota over American brands. This may be a perception of quality, or perhaps reflects a stronger international influence on these areas. From a bank or credit union’s perspective, this information could drive marketing focus towards these types (though not the specific model) of vehicles. It could also shed valuable insight into what the consumers in their market value most (utility, value, convenience, etc.)
Often times, when utilizing maps, scale is important. In the Business Insider map, we see information on a state by state level, which, while useful, is somewhat limiting. It can give generalizations, but doesn’t shed light into how buying decisions are being made on the ground.
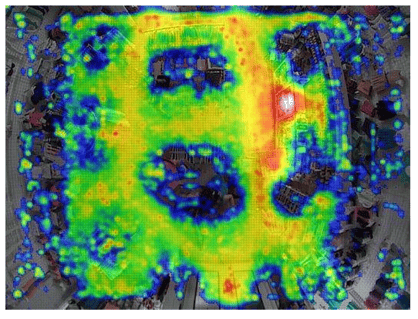
Now let’s look at the opposite end of the spectrum with a map that provides information at the storefront level.
The next map is a heat map of in-store traffic from a retail store. Instead of providing insight into what specific demographic and socio-economic factors might be influencing consumer decisions, now we can identify what physical factors in a space impact consumer decisions.
The map on the right is a heat map showing consumer traffic in a retail space. The darker the red, the more traffic an area sees, the blues indicate very little consumer traffic.
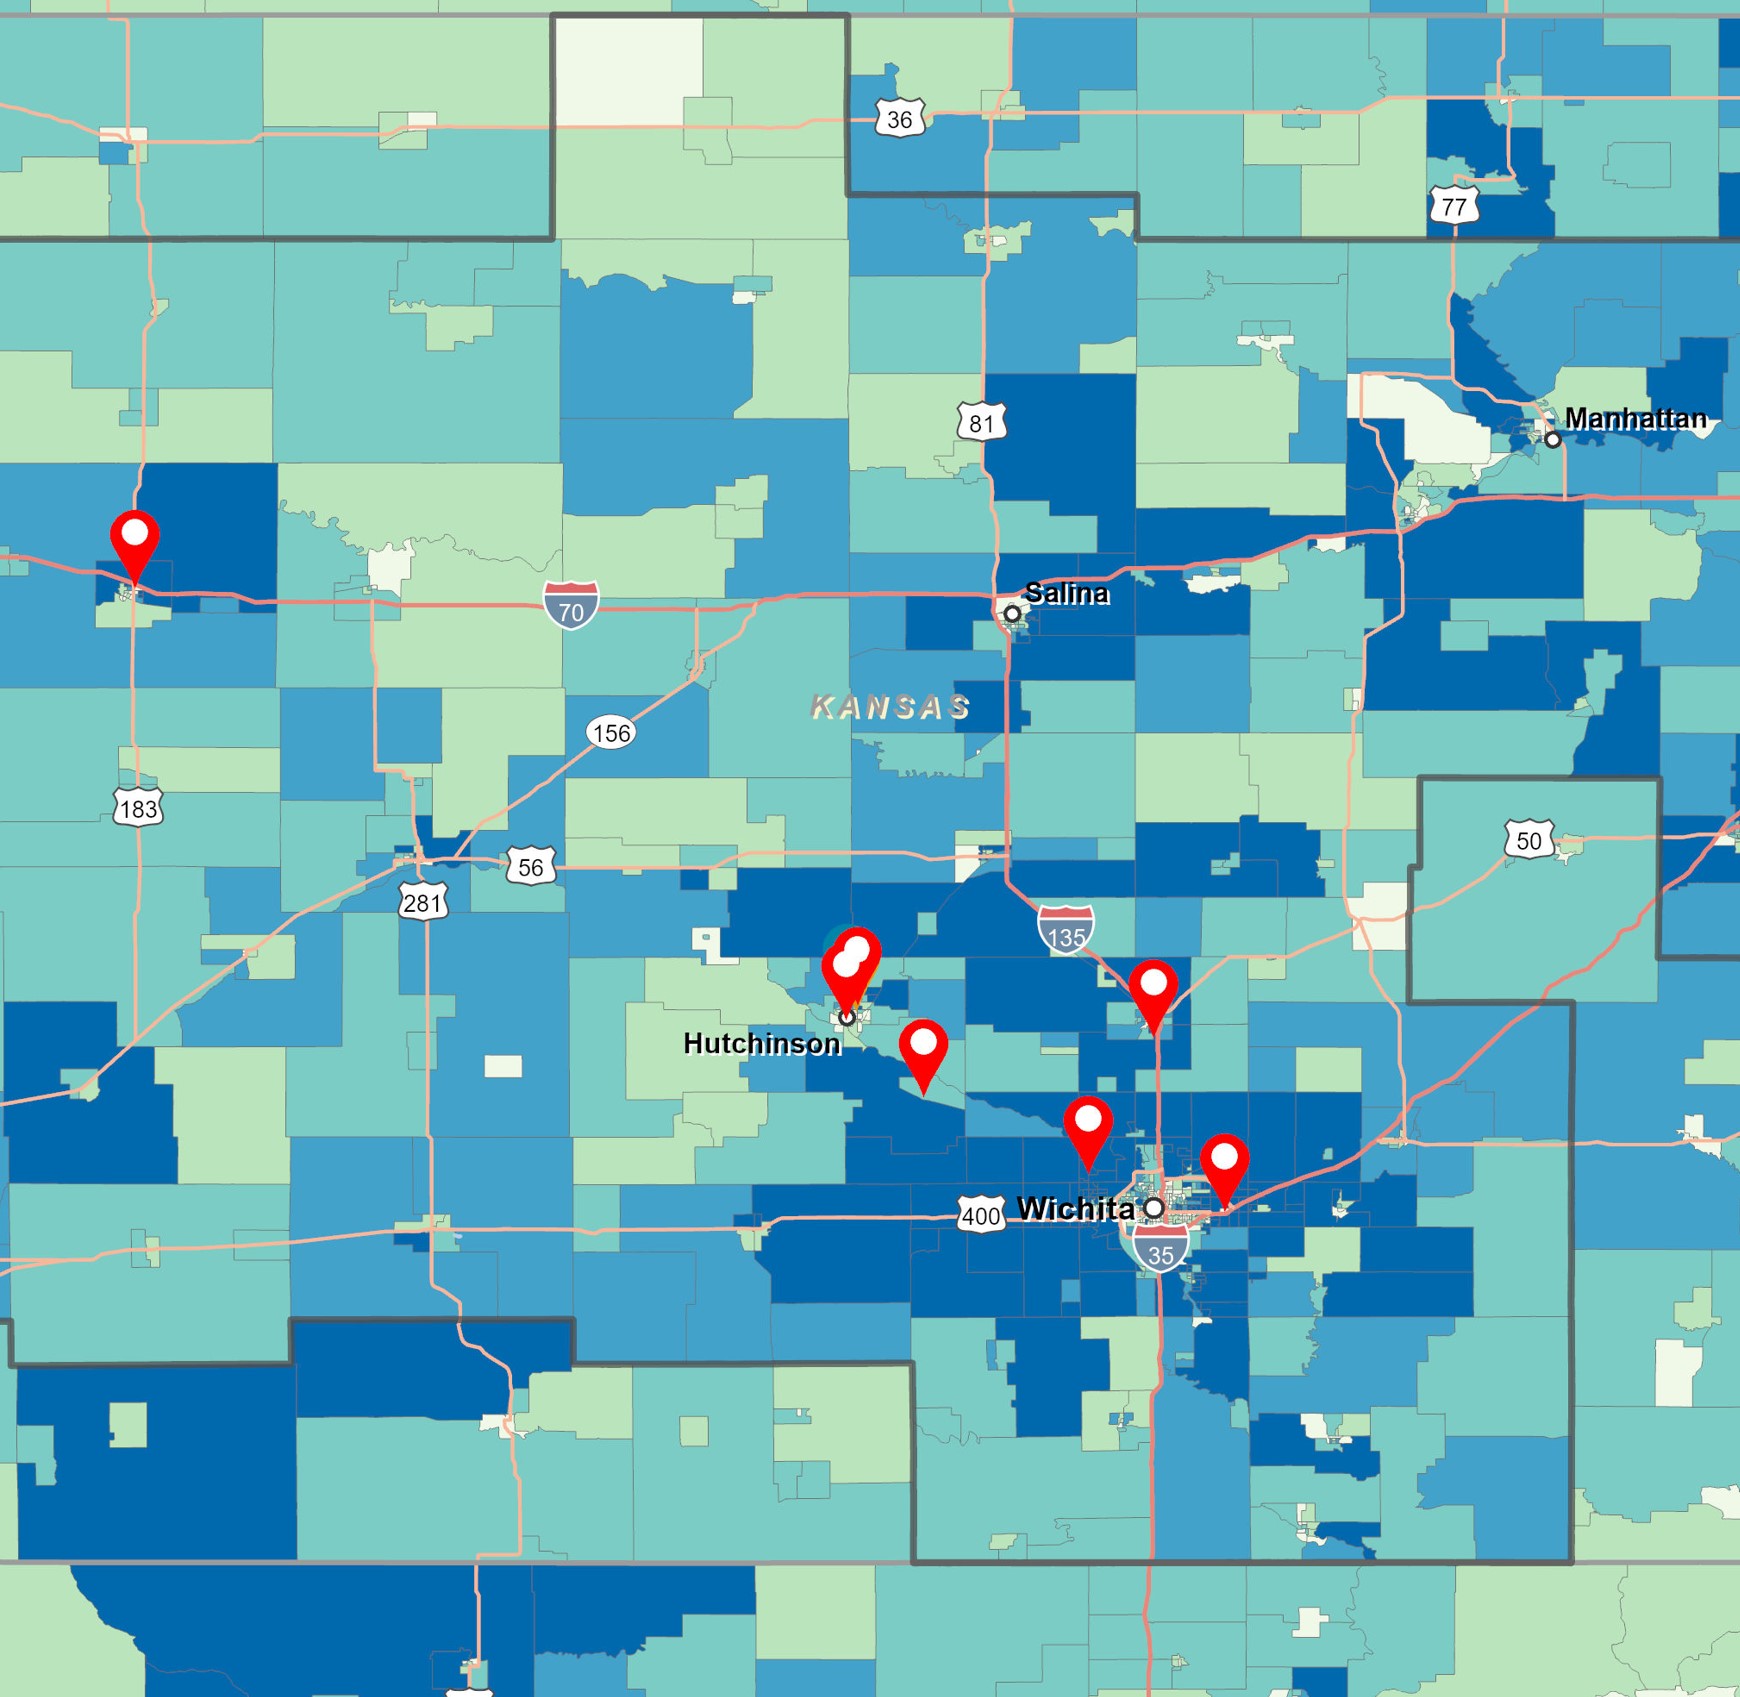
Even at their most basic level, maps can provide valuable insight for financial institution leaders. With the right set of maps, showing the right data, at the right scale, all of those questions that plague Presidents & CEO’s, marketing and operations, even branch managers, can be readily answered.